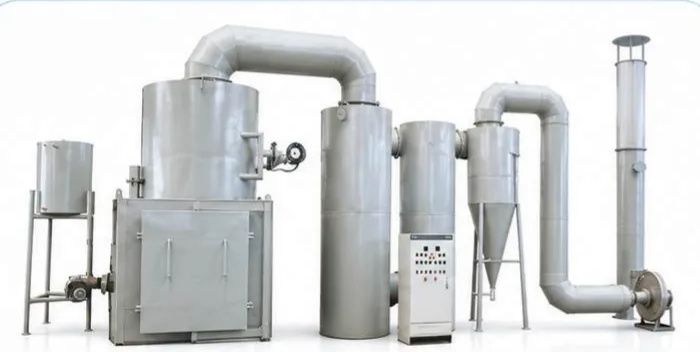
Dioxin formation does not stop at the furnace
The combustion half of this subject — the 850 °C secondary chamber, the two-second residence time and what they destroy — is covered in the article on why incinerators run at 850 °C for two seconds. This article takes the second half, which begins at the chamber outlet and ends at the stack.
The reason is that dioxins are not only destroyed and emitted; they are also made. Carbon, chlorine, oxygen and a metal-bearing surface are all present in the gas and in the fly ash it carries, and between roughly 200 °C and roughly 400 °C those ingredients can be assembled into polychlorinated dibenzo-p-dioxins and dibenzofurans faster than the destruction reactions of the hot zone can compete. Dioxin formation in that band is the reason a plant with a perfect combustion chamber can still fail its stack limit.
Two routes produce it, and although they are described separately in the literature they share a temperature band and a surface, so the engineering answer to both is the same.
De novo synthesis of dioxins on fly ash
De novo means from new: the carbon skeleton is built from carbon that is already present in the fly ash rather than from a dioxin-like precursor. The reaction is heterogeneous — it happens on the surface of the particles rather than in the gas — and it needs three things at once that the gas stream supplies for free downstream of the chamber: unburned and soot carbon in the ash, a source of chlorine, and a surface that catalyses the reaction.
The catalyst is what makes this route so sensitive to the waste. The ash surface carries metals, and the chlorides of copper and iron in particular are reported to promote the reaction strongly. Two wastes burned with identical temperature profiles and identical chlorine loads can therefore produce very different results, and a waste stream high in copper or iron deserves to be treated as a higher-risk feed for re-formation, not only for corrosion.
De novo synthesis is an oxidative chlorination, so it also needs a little oxygen. That rules out a tempting but wrong simplification: a gas that has merely been cooled is still in the active band with every ingredient the reaction needs.
The figures usually quoted put the fastest part of this reaction in the region of 300 °C, with the band of concern extending over roughly 200 to 400 °C. They should be read as a starting method rather than as a specification: they describe where the reaction is fastest on a typical fly ash, not a boundary at which it switches on and off.
The precursor route: dioxins assembled from molecules already in the gas
The second route does not build the carbon skeleton from ash carbon. It starts from smaller chlorinated aromatic molecules — chlorobenzenes and chlorophenols — already present in the gas, which condense onto the fly ash surface and couple there into dioxins and furans. The product is the same family of compounds; the raw material is different.
Because the two routes share their temperature band, they are answered by the same measures, but they point at different upstream problems. The precursor route needs a supply of chlorinated aromatics, which is a combustion problem: a chamber that destroys its organic compounds properly also stops supplying them. De novo synthesis needs the ash, the catalyst and the oxygen, which is a gas-train problem.
The 200 to 400 °C window and the rate of cooling
The reactions take time. What produces dioxins is not passing through a temperature but spending time in it, so the quantity a designer controls is the time the gas spends inside the window, not the temperature at any single point. Gas that crosses the band in a fraction of a second forms far less than gas that drifts through it over minutes, which is the justification for rapid cooling after the chamber.
That is why a single temperature reading is a weak specification. A quench reporting a low outlet temperature says that the gas is out of the window now; it says nothing about how long the gas took to get there, or whether part of the stream passed slowly through the vessel along a wall. The duty is described by the temperature at each end of the cooling section and the residence time spent between them.
Load range matters as much as the design point. Gas velocity falls with the load, so a plant idling at a fraction of its rated throughput takes longer to cross the window than the same plant at full rate, and a cooling section adequate at the design point can be marginal at low load. The low-load condition is where the residence time in the window is longest.
Quench cooling in waste incinerators
The commonest answer to the window is an evaporative quench. Water is sprayed into the gas stream, and the latent heat of evaporation takes the temperature down without any heat-exchange surface for dust to foul; because the cooling happens in the gas itself, the drop is fast. The stages that follow it are described in the article on flue gas treatment in an incinerator.
The alternative is heat recovery, and there the trade is real. A waste-heat boiler recovers sensible heat that a quench simply evaporates away, but it presents a large surface area and a long gas path, and the gas spends correspondingly longer inside the window on its way through. Plants that do both arrange the boiler so that the band is crossed in its hottest, most compact section, or accept a degree of re-formation inside the boiler and remove the products downstream.
One consequence of either choice is the temperature at the inlet to the particulate filter. That figure is set by the bag material, and it has a useful side effect here: a filter operating below the window leaves the collected ash outside the range that promotes further de novo synthesis.
After the quench: adsorption and the memory effect
Cooling reduces formation; it does not remove what has already formed. That duty falls to adsorption, and the usual arrangement is powdered activated carbon injected into the duct ahead of the bag filter, so that the carbon builds into the filter cake and the gas passes through a bed of it rather than merely alongside it.
There is a behaviour worth knowing before the plant is specified. Dioxins that were adsorbed earlier can be released again when conditions change — a temperature swing, a load change, a stop and a restart — so a plant can emit more after an upset than its steady-state design predicts. Keeping the collected ash cold and stable, and keeping the carbon injection running continuously, is what limits it.
How the stack figure is counted
Dioxins are not one compound. The family runs to 210 congeners of polychlorinated dibenzo-p-dioxins and dibenzofurans, of which the seventeen with chlorine in the 2,3,7,8 positions are the ones that carry the toxicity. A stack result is therefore a weighted sum: each congener is multiplied by a toxicity equivalence factor and the products are added, giving a single figure in nanograms of toxic equivalent per cubic metre, written ng TEQ/m³.
The limits that apply to the incinerators here are set in that unit. In the chart of incinerator emissions, medical and hazardous waste incineration carries a limit of 0.5 ng TEQ/m³ as a measurement mean, and municipal solid waste incineration a limit of 0.1 ng TEQ/m³ for dioxins and furans. Dioxin control in medical waste incinerators is therefore a question about the whole chain, from chamber to carbon, rather than about any one of its stages.
One property of that figure shapes how it should be used. It is a mean over a defined sampling period, not a spot reading, so it describes the plant under normal operation rather than during its worst minute. A compliant figure does not by itself prove that the cooling design is generous, which is why the cooling section is designed from the temperature profile and the residence time, and the stack figure is used to confirm the result rather than to set the design.
Common mistakes
- Specifying a quench outlet temperature and nothing about the time the gas spends in the window. The temperature says where the gas is, not how long it took to get there.
- Slowing the quench cooling in waste incinerators to recover more heat without asking what the gas passes through on the way down. Heat recovery and dioxin control pull in opposite directions across the same band.
- Treating 850 °C and two seconds as the whole dioxin answer. They govern destruction in the chamber and say nothing about what is made afterwards.
- Letting the filter inlet temperature drift upwards, so that the collected ash moves back towards the window it was removed from.
- Ignoring the ash chemistry. A feed high in copper or iron gives the fly ash a more active surface, and the same temperature profile then produces more.
- Sampling once and treating the result as a plant property. The figure is a mean over a period, and it is only meaningful with the period, the load and the operating conditions attached.
Self-check before the cooling section is specified
- Is the gas temperature known at every point between the chamber outlet and the filter inlet, not at the two ends only?
- Is the residence time between the top and the bottom of the window stated as a design figure?
- Has the cooling been checked at the lowest load the plant will run, where the gas is slowest?
- Is the filter inlet temperature matched to the bag material and held below the window?
- Is the adsorbent injection rate sized for the re-formation load, and is it a continuous duty?
- Are start-up, shutdown and load-change conditions covered, given that adsorbed material can be released again?
- Is the target stack figure expressed in ng TEQ/m³ over a stated sampling period?
From a temperature profile to a stack figure
Dioxin re-formation in flue gas is controlled by a chain rather than by a device: destruction in the chamber, a cooling section that takes the gas out of the active window quickly, and an adsorption stage that catches what formed anyway. The chart of incinerator emissions sets the limit the chain has to meet, and the article on flue gas treatment covers the stages that follow the cooling section. Send us the waste composition and the standard that applies, and the cooling arrangement, the adsorbent injection rate and the filter duty for your plant are confirmed with the factory for your waste and your limit.