Start with the population, not the equipment
A containerized plant is sized on two loads — hydraulic flow and organic load — and the hydraulic side starts from the people the plant serves. National practice converts domestic water use into sewage flow with a fixed rule: the combined domestic sewage allowance is 90% of the local water-use allowance (GB 50014-2021 §4.1.14). Per-capita water-use allowances themselves are banded by water-resource zone and city size, from 50 L per person per day in the lowest band to 320 L per person per day in the highest.
Export projects often work from a single national convention instead. British Water Flows and Loads gives 150 L per person per day for the UK; the US EPA figures are about 170 L per person per day as a residential typical, with design often taken as 284 L per person per day. The point is not which figure is right in the abstract. It is that the allowance has to match the project region and be stated before anything is multiplied.
- Confirm the served population, including any growth the site expects.
- Take the water-use allowance for the project region and water-resource zone.
- Apply the conversion rule to reach the combined domestic sewage allowance.
From per-capita allowance to average daily flow
Average daily flow is the population multiplied by the per-capita sewage allowance. The worked example on the population-to-capacity chart uses Zone 2, a medium city and 120 L per person per day: converted at 90%, that is 108 L per person per day of sewage, and a served population of 10,000 people gives an average daily flow of about 1,080 m³ per day. That figure is an average, and an average is not yet a design flow.
Where the population is not the driver — an industrial estate, a food plant, a hospital — the flow comes from the water meter or the process brief instead, and the per-capita route is only a cross-check.
Apply the peaking factor Kz
Plants do not receive flow at a steady average. The dry-weather variation factor Kz scales the average daily flow up to the peak, and tanks and pipes are sized on the peak. GB 50014-2021 Table 4.1.15 gives Kz of 2.7 at 5 L/s, falling through 2.4 at 15 L/s and 1.9 at 100 L/s to 1.5 at 1,000 L/s and above; intermediate flows are interpolated.
Two cautions come with that table. The 2021 edition raised these factors: the superseded 2006 edition used values from 2.3 down to 1.3, and much published material still quotes the old set. Separately, the Middle East convention is different again — the Saudi MEWA design guide uses 1.6 for large cities and 2.2 for villages and towns. An export calculation should state which convention it follows.
Check the organic load, not only the flow
A plant can be hydraulically correct and still undersized, because the biology is sized on what the water carries. Municipal sewage concentrations are published as industry statistics rather than standard values: a national survey of 127 treatment plants gives mean COD of 220 mg/L, BOD₅ of 81.6 mg/L and suspended solids of 148.5 mg/L, with the 80th-percentile values listed separately. Common design practice sits above the survey means, at 250–450 mg/L COD and 100–200 mg/L BOD₅.
Industrial wastewater is a separate case. Where a waste stream carries a high organic load — food processing is the usual example — the organic load governs the plant size, and pre-treatment is settled before the biological stage is sized.
Turn the design flow into tank volume
Tank volume follows from the flow and the residence time the process needs: V = Q × HRT. The hydraulic residence time is set per tank duty. National practice gives 1–2 h for the anaerobic tank and 0.5–3.0 h for the anoxic tank, with a solids retention time of 3.5–7.0 days where phosphorus removal is the main objective. Where extended aeration is used, the Middle East guide gives an aeration time of 18–36 h and a sludge age of 10–30 days.
Sizing on the peak flow is the conservative choice for tanks that have to pass the peak, while a biological stage designed on load is often sized on the average flow. Whichever is used should be stated, because the two answers differ.
From volume to footprint and container type
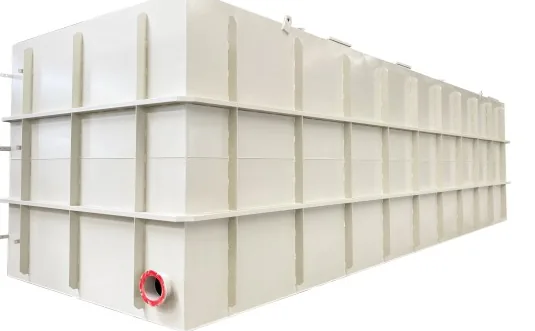
Volumes then become a footprint. A single containerized unit covers a design flow of 0.5–15 m³/h, or 12–360 m³/day, and the assembled equipment ranges from about 3 × 1.5 × 2 m to 16 × 3 × 3.5 m depending on capacity. The larger end of that range cannot travel in a standard dry container, whose internal width is only 2.352 m, and it is the width and the height that decide the shipping route rather than the volume.
This is why sizing ends with a loading check rather than a purchase order. The required capacity decides how many units the plant needs; the dimensions of each unit decide whether it ships in a dry container, in an open-top or flat-rack container, or as break-bulk cargo. Only when those two answers agree is the plant ready to be quoted.