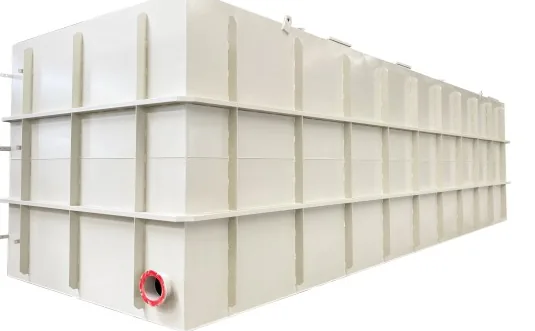
What a wastewater equalization tank does
A wastewater equalization tank sits between the inlet works and the process it protects. It takes flow at whatever rate it arrives and releases it at a rate the downstream plant can treat, which decouples the two. On a municipal plant the arrival rate swings through the day; on an industrial site it swings with a shift pattern or a batch discharge.
It does two jobs, and they are sized differently. Flow equalization buffers the rate at which water arrives; load equalization buffers the mass of pollutant arriving per hour. A tank that is mixed as it fills does some of both, but a plant fighting a batch discharge of strong liquor needs a volume sized on mass, not on litres.
What the tank buys downstream is a smaller and steadier plant: a biological stage that does not have to be built for the peak hour, dosing equipment that works at a constant rate, and a pH or temperature excursion that arrives diluted instead of as a wave.
Peak wastewater flow: what the number means
The peak flow is not one number. It is at least three, and a design that quotes one of them without saying which is not yet a design. The first is the peak hour on a dry day, the morning or evening surge most municipal plants are sized on. The second is the peak day, the highest 24-hour volume. The third is the wet-weather peak, infiltration and inflow after rain, which in a combined or leaky sewer can multiply the dry-weather peak while diluting its strength.
The factor that turns an average into a peak is the subject of the peaking factor chart, and its behaviour is the same everywhere: the smaller the population served, the larger the factor. An industrial site has no peaking factor in the municipal sense; it has a shift pattern, read from its own record.
The peak that matters for sizing is not the largest number in the record. It is the largest number the downstream process cannot absorb, and the difference between the two is what the tank is for.
Flow equalization in wastewater treatment: what gets buffered
It spreads the arrival of water over more hours, and what it does not do is remove any load: the same kilograms of BOD still arrive over the day, spread more evenly. Whether that makes the load easier or harder depends on how concentration and flow move together in your sewer.
In a municipal sewer, flow and strength usually rise together, because the morning surge is also the strongest flow, so flattening the flow also flattens the mass load. An industrial discharge is often the opposite: a strong batch arrives in a small volume, at an hour unrelated to the domestic peak. Spreading it over more hours spreads the mass rather than reducing it, which is usually what the biology wants, but the mass does not disappear. Where the load rather than the flow is the problem, the volume has to be sized on the mass curve.
Mixing as the tank fills has a second consequence: averaging tends to pull the peaks of flow and concentration down together, which helps in municipal service and can be unhelpful where a high-strength stream needs to be kept separate rather than diluted. The design influent quality chart sets out the figures a plant is normally designed against.
Sizing by the mass curve, not by a percentage
The method that answers the question properly is a cumulative volume curve. Plot cumulative inflow volume against time across the design day, draw the cumulative volume that would leave if the draw were constant, and the largest vertical distance between the two lines is the storage the tank has to hold: the amount by which arrival ever runs ahead of the draw.
Three practical points decide whether the answer is worth anything. The record has to cover the worst day rather than a typical week, because a tank sized on an average day has no capacity left for the day it was bought for. The interval has to be fine enough to show the peak. And where no record exists, a curve has to be built from population, allowance and a peaking factor, then treated as provisional until the plant has a flow meter of its own.
Design practice often quotes a starting range of the order of 10 to 30 per cent of the daily flow for municipal service, or a volume equivalent to several hours of average flow. Read that as a starting method rather than as a specification: it is a sanity check on the mass-curve answer, not a substitute for it, and combined sewers, high infiltration and industrial batch discharges all push the required volume away from the middle of the range.
Hydraulic retention time in an equalization tank
The hydraulic retention time in an equalization tank is the volume divided by the flow, an outcome of the sizing rather than an input to it: quoting six to twelve hours first and sizing the tank to that number is how the buffering gets designed out of the plant. It is still worth calculating, because it tells you what else the tank will do. A long retention time in a warm climate turns an unaerated basin into a settling tank and then a septic one, with solids accumulating and sulphide appearing, and a short one on a site with a sharp industrial peak does not buffer it at all. The tank volume and HRT chart covers how a residence time becomes a basin volume.
Peak load, and the case where it disagrees with peak flow
Where the load arrives in batches, the binding constraint is mass rather than volume, and the curve to build is cumulative mass against cumulative treatment capacity. The read-off is the same: the largest gap between what has arrived and what the process could have dealt with is the storage the tank has to provide, here as a volume at the concentration the tank is mixed to.
The two answers are often different, and the design then has three options: size the single tank to the larger of the two; split the duties between a flow basin and a load basin; or reduce the batch at source, by an upstream industry equalizing its own discharge or by a production change that stops the strong liquor arriving in one slug. The third is usually the cheapest.
Mixing, aeration and the draw in a wastewater equalization tank
A basin that is not mixed is a settling tank with a level control on it: solids settle, the effective volume falls, and the tank hands the process a concentrated slug when it is finally drawn down. Mixing keeps the contents uniform, so what leaves is representative of what arrived. The arrangement that provides it — submersible mixers, a coarse-bubble grid or a pump-around — depends on the solids in the flow and on whether the contents have to stay aerobic.
Aeration is a separate question. It is needed where the contents would otherwise go septic, which means long retention, a warm climate, high organic strength or sulphide in the incoming sewage, and it is the cheapest way to keep a basin both mixed and aerobic. It is not free: an aerated basin consumes oxygen, and a tank aerated without a duty is a running cost with nothing to show for it.
The draw arrangement decides how much of the calculated volume is usable. A tank drawn down by a fixed-rate pump holds its buffering only down to the low-level cut-out, and the volume below that point is dead. A variable draw, a draw that follows the capacity of the downstream process, or a pair of basins drawn alternately all change how much of the volume is actually available.
Common mistakes
- Sizing from a percentage of daily flow with no flow record behind it: the percentage is a check on an answer, not a method.
- Coarse flow records. The peak wastewater flow may last twenty minutes and still vanish into a daily total.
- Assuming the draw is constant, when the mass-curve read-off assumes it is.
- Forgetting the dead volume below the low-level cut-out and the freeboard above the high level.
- Putting the tank in front of the screens and grit removal, which protect its mixers and pumps.
- Leaving the basin unmixed, then blaming the process for the slugs.
- Letting the hydraulic retention time in an equalization tank run long enough to turn the basin septic, without planning the aeration it then needs.
- Treating flow equalization in wastewater treatment as load equalization: the volume that buffers litres is not the volume that buffers kilograms.
Self-check before the volume is fixed
- Is there a flow record covering the worst day and the worst season rather than a typical week?
- Is the interval fine enough to show the shortest peak that matters?
- Has the required storage been read off a cumulative volume curve?
- Has the load curve been built as well, where the site has a batch or shift-driven discharge?
- Which of the two is binding, flow or load, and has the tank been sized on that one?
- Does the wastewater equalization tank mix well enough to keep solids in suspension at the retention time chosen?
- Is aeration needed to stop the contents going septic, and has its running cost been counted?
- How much of the nominal volume is usable between the low-level cut-out and the high-level alarm?
From a flow record to a basin
The volume comes from the operating data of the plant rather than from a table: a flow record over the worst day the site can expect, read off a cumulative curve against the draw the downstream process can take. The tank volume and HRT chart shows what a residence time means as a basin volume, the plant selection and sizing guide works the same ground from design flow and effluent standard, and the containerized sewage treatment plant page describes the packaged form of the same duty. Where the equalization volume and the biological stage are bought together, the volume and the flow pattern to design for is confirmed with the factory for your flow record and influent analysis rather than assumed from a table.